Stop Making Six-Figure Decisions on Bad Data
STRProfitMap gives short-term rental investors the most accurate market data, property analytics, and comp insights. So you buy with confidence, not guesswork.
✓ Reliable listings only · ✓ 20,000+ US markets · ✓ Property analyzer

Your Next Investment Is Only as Good as Your Data
Most Airbnb data tools analyze every listing: abandoned properties, seasonal hobbyists, listings with two reviews. Then they call it "market data." You make a $100K+ decision on it.
STRProfitMap takes a different approach. We filter down to reliable listings only, properties with proven track records, consistent bookings, and real revenue history. The noise is gone before you ever see a number.
The result: data you can actually underwrite with confidence.
Built for Serious STR Investors
Clear insights, actionable data, and tools designed for professional hosts and property managers
Profit Heat Maps
Instantly visualize the most profitable STR zones in any city or state. Avoid the noise, focus on ROI.
AI Buy Box Insights
Learn which amenities, sizes, and price points attract the best revenue in each market.
Market Intelligence
Track occupancy, ADR, seasonality, and trends across 20,000+ markets.
STR Regulation Insights
Navigate legal risk by understanding market-specific short-term rental laws.
Export-Ready Reports
Need to underwrite or pitch to investors? Download the data you need in seconds.
Zip Code Analytics
Zoom in on profitable micro-neighborhoods with zip code level data exports.
Our Product
Market analysis for all US cities, for investors by investors
Top Short Term Rental Markets
Explore the most profitable short-term rental markets in the US based on cap rate, revenue, market saturation...


Simple Pricing. Serious Value.
Start free, upgrade when you're ready, and run acquisition decisions on a platform designed for serious operators.
Starter
 Coverage across every U.S. state
 Full U.S. Market Analytics (20,000+ markets)
- CSV export tools
- Profit maps
- AI Buy Box
- Regulation Data
- Unlimited property analyzer
No credit card required

Pro Annual
- Coverage across every U.S. state
- Full U.S. Market Analytics (20,000+ markets)
- CSV export tools
- Profit Maps
- AI Buy Box
- Regulation Data
- Unlimited property analyzer
Secure Stripe checkout
Pro Monthly
- Coverage across every U.S. state
- Full U.S. Market Analytics (20,000+ markets)
- CSV export tools
- Profit Maps
- AI Buy Box
- Regulation Data
- Unlimited property analyzer
Secure Stripe checkout
Need a custom workflow for your team? Talk with us
Trusted By Investors Making High-Stakes STR Decisions
Real outcomes shared by operators using STRProfitMap to validate markets faster, avoid expensive mistakes, and grow with more confidence.
20,000+ U.S. markets
Coverage depthSecure Stripe billing
Trusted paymentsCancel anytime
No long-term lock-inInvestor-ready insights
Built for acquisitionsFound an overlooked neighborhood that outperformed our baseline.
STRProfitMap showed me an overlooked neighborhood in Austin that now generates 32% higher returns than my previous properties. I used their profit maps to focus my search.

John R.
Property Manager at Shoreline StaysBooking rate jumped after switching into less saturated pockets.
I was stuck in saturated markets until STRProfitMap revealed under-the-radar spots. My booking rate increased by 24% within the first month after relocating.

Marcus L.
Airbnb HostIt's like an AI analyst for investment strategy.
The AI-powered buy box tool saved me countless hours of research. It's my go-to tool before I acquire a property and has transformed my investment approach.

Sophia R.
Portfolio ManagerFound hidden cash-flow opportunities in a market everyone ignored.
In a market everyone said was saturated, STRProfitMap helped me identify micro-neighborhoods with 40% higher ADRs than surrounding areas.

Isami D.
Real Estate InvestorAvoided a costly regulatory mistake before closing.
The regulation data saved me from investing in an area that was about to implement strict STR restrictions. This feature alone paid for itself 100x over.

Lucas M.
Property Portfolio OwnerDecision-making time was cut in half across our deals.
I can now underwrite properties in minutes instead of hours. The export feature lets me quickly run numbers and compare properties side-by-side.

Emile B.
Entrepreneur & STR InvestorClosed faster because everyone reviewed the same data.
Our acquisitions team uses STRProfitMap as the single source of truth before LOI. It reduced back-and-forth and sped up our approvals significantly.

Naomi P.
Director of AcquisitionsStopped guessing and started filtering deals with clear criteria.
The market and regulation views helped us reject weak opportunities early. That discipline improved our pipeline quality almost immediately.
Daniel K.
STR Fund OperatorExpanded to a second market with less uncertainty.
Instead of betting on anecdotal data, we compared markets side by side and validated demand before committing. It changed how we expand.

Rina S.
Co-Host & Portfolio BuilderOur underwriting process is finally consistent.
Before STRProfitMap, every analyst had a different approach. Now we use one framework and make decisions with much less noise.

Trevor M.
Operations Lead, Staywise HomesExpert Insights & Resources
Explore our latest articles to help you make smarter STR investment decisions


Frequently Asked Questions
Everything you need to know about our platform
 What data do I get access to in the tool if I subscribe?
 Where does the data come from?What defines a "reliable listing" on STRProfitMap?Why does STR Profit Map only aggregate reliable listings?Is there a free trial or demo I can access?I don't see my city/town/neighborhood. Do you not have it?What does the revenue percentile mean?
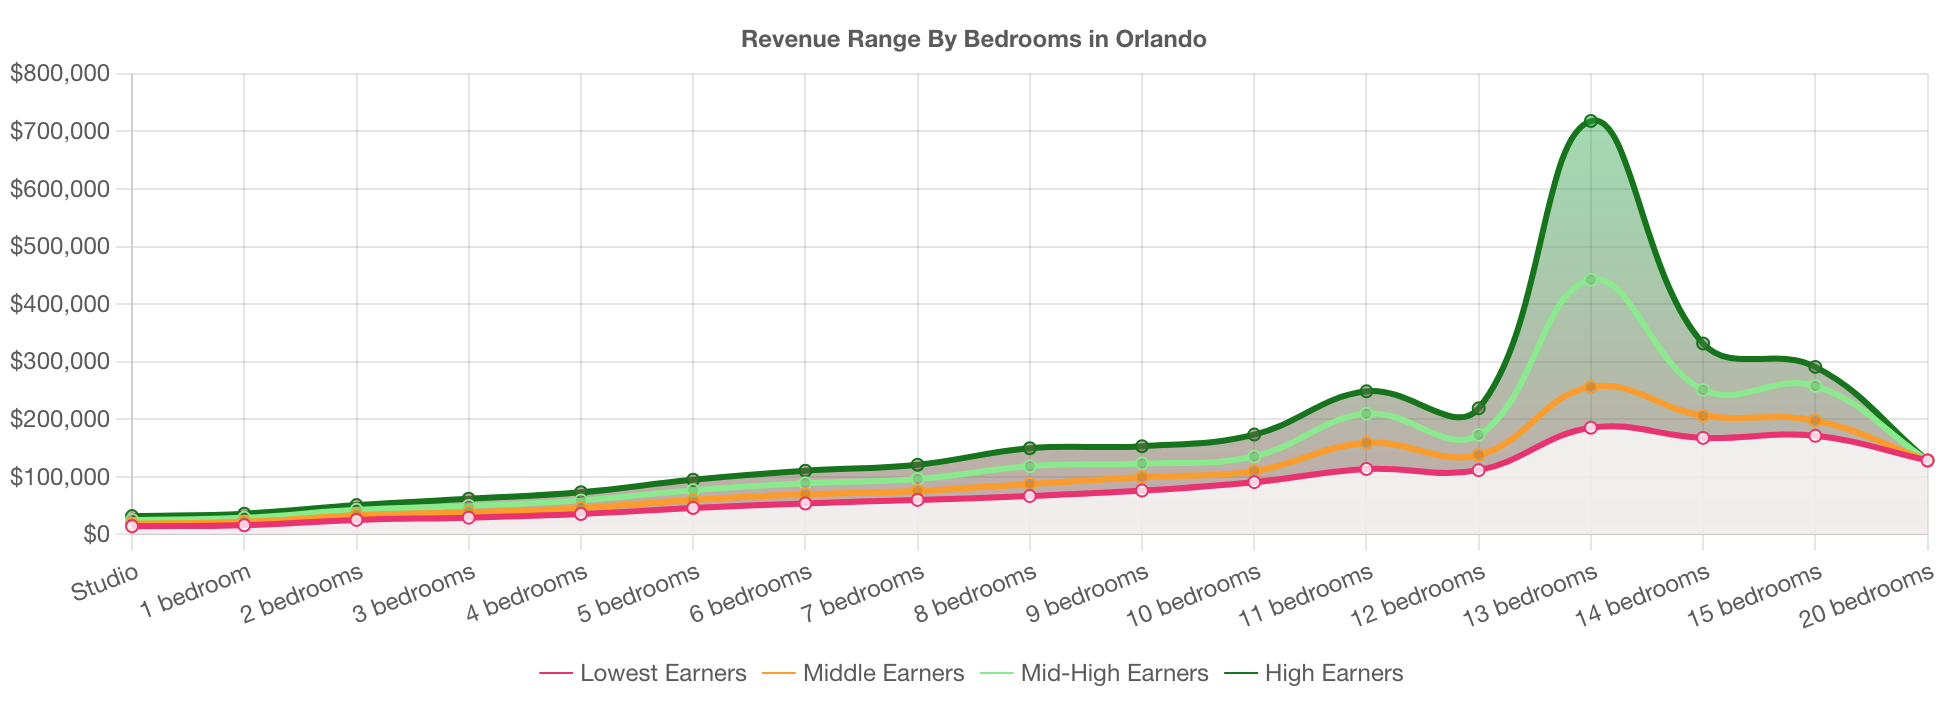
Lowest Earners: Bottom 25%
Middle Earners: Median
Mid-High Earners: Top 25%
High Earners: Top 10%
Can I cancel or pause my subscription?Still have questions?
If your question is not listed here, please reach out to our dedicated support team.
Ask Your Question